The Idea of the Project
TLDR: The project is supposed to be an easy way of exploring a data source like the ONE API and building diagrams from it. The catch is, that integration of new sources should be relatively easy.
The Code
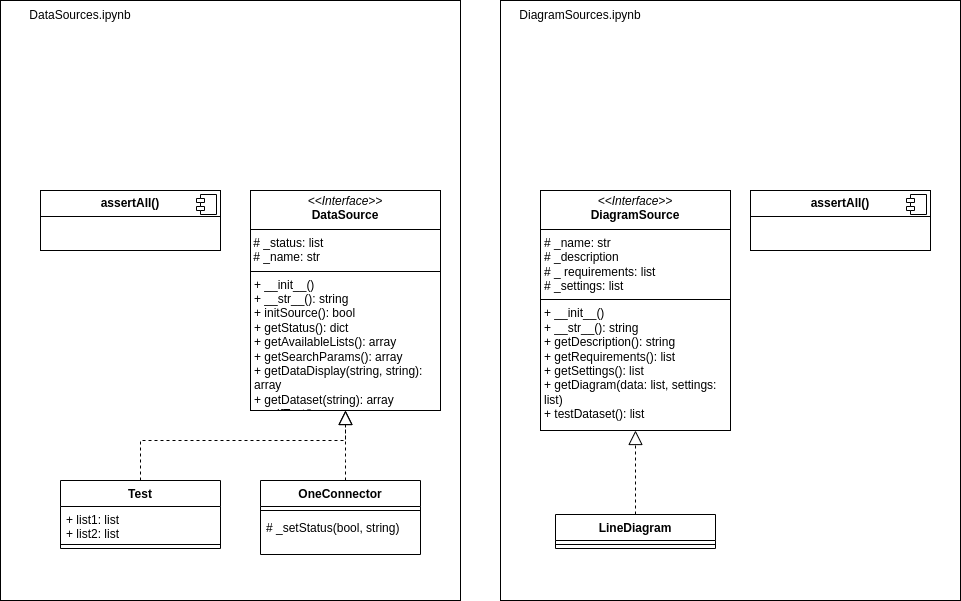
Integration of the sources was done in a Jupyter Notebook, that also provides an assessment method and a test class. With that, integration of a new source should be pretty straight forward.

The Jupyter Notebooks data_source.npynb and diagram_source.npynb (the "Model" in the MVC-Pattern), get imported via the interface by the Control-Module. It also acts as an adaptor between View-Module and Model-Module.
The View-Module uses the Textual framework, to build a CLI-Interface.

Communication between the modules is handled by using the observer pattern, to keep dependencies minimal and allow easy adjustment of the code.
The Interface
On the graphical side, the program provides visualisation of the data structure and easy creation of data visualisations with diagrams.

Features:
- Selection of sources (data & diagram) and adjustment of the gui to the source
- Error handling in Model and display in LoadScreen and StatusScreen
- Async loading of sources to make gui still useable if a source fails loading
- Selection of datasets from various sources and creation of visualization from chosen datasets
- Selection from available visualizations