In the project group "functional genomics of fungal morphogenesis",
we work on several aspects of molecular biology of fungal development. More detailed information can be found in
several
publications on these subjects. Students can participate in current research
projects during "S-Modul" courses that are offered at the
Department of
Molecular and Cellular Botany. These are four- or six-week lab courses that can lead to bachelor- or master-projects.
Multicellular development like, for example, the development of fungal fruiting bodies, requires the coordinated expression
of many genes. Gene expression must happen at the right time and in the right place (here, the right cells of the organism)
to result in a functional fruiting body. Also, external signals like light, temperature, humidity, availability of nutrients
and many others have to be taken into account and appropriate genetic programs have to be activated to cope with different
conditions. During the last few years, methods like microarrays and RNA-seq have been developed that make it possible to
monitor the expression of hundreds to thousands of genes at a time. We are currently working on projects to investigate
differential gene expression in several filamentous fungi, as well as comparative genomics projects. Analyses like these
can help us to unravel how a fungal genome controls multicellular development. In another line of research, we study the evolution of mating type loci
in basidiomycetes. Mating type loci determine compatibility between strains as a prerequisite for sexual develoment.
1. Functional genomics of fruiting body development in the filamentous fungus Sordaria macrospora
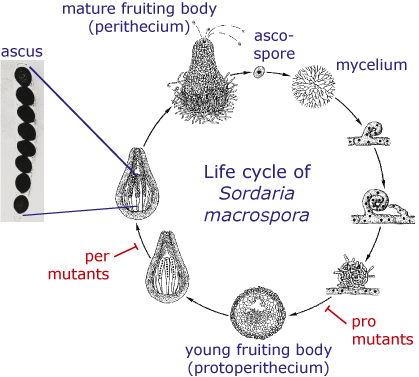
Sordaria macrospora is a filamentous ascomycete which is closely related to Neurospora crassa. But in contrast to Neurospora, Sordaria is homothallic, which means that a single strain produces fruiting bodies without the need for a partner of opposite mating type. The life cycle of S. macrospora is shown in the picture. It starts with an ascospore which germinates and produces a mycelium. Within a week, fruiting bodies develop in which asci are produced that contain eight ascospores each. The ascospores are ejected from the fruiting body and the cycle starts again.
- In several Sordaria mutants, the life cycle is disrupted at some point so that the mutant cannot produce mature spores any more. Some of these mutants can only produce immature fruiting bodies, so-called protoperithecia. These mutants are called pro mutants, whereas mutants that form perithecia, but no mature ascospores, are called per mutants.
- A focus of our analyses is the role of chromatin modifiers and transcription factors in multicellular development. In previous studies, we could show that the histone chaperone ASF1 and the transcription factor PRO44 are essential for fruiting body development in Sordaria macrospora. We have now analyzed the functions of the two developmental genes asf1 and pro44 in Sordaria macrospora using RNA-seq, MNase-seq, BS-seq, fluorescence microscopy and protein-protein interaction techniques. Our results show that even though both genes are required at the same stage of fruiting body development, they regulate different aspects of sexual development. While asf1 acts as a suppressor of weakly expressed genes during morphogenesis, transcriptome analysis of gene expression in young fruiting bodies showed that pro44 is required for correct expression of genes involved in extracellular metabolism. Deletion of the putative transcription factor gene asm2, which is downregulated in young fruiting bodies of the pro44 mutant, results in defects during ascospore maturation. More details can be found in our publication of this study (Schumacher et al. 2018, BMC Genetics 19: 112).
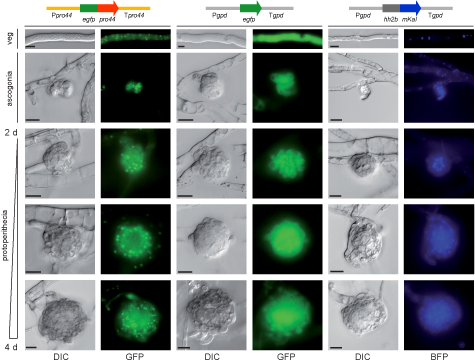
This picture shows the localization of the PRO44 protein within developing fruiting bodies. PRO44 was fused to the green fluorescent protein (GFP) to visualize its localization by fluorescence microscopy, and the fusion construct was expressed under control of the pro44 promoter and terminator regions (left). As a control, a construct expressing only GFP (middle) and a construct expressing a fusion of a blue fluorescent protein with histone H2A (right, H2A localizes to the nucleus) were used. PRO44 localizes to the cell nucleus, but in developing fruiting bodies, it is preferentially present in the outer layers and not in the core of the fruiting body.
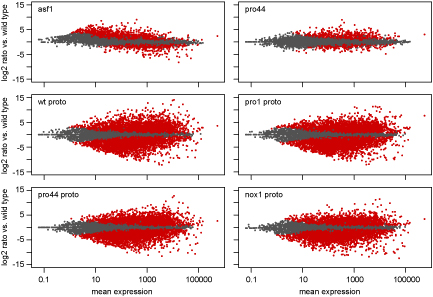
As part of this study, we used a combination of laser microdissection (LM) and RNA-seq. LM enables us to isolate young
fruiting bodies from the surrounding mycelium. We can then extract RNA from these protoperithecia and use this for RNA-seq. The picture shows MA plots, where the expression ratio for each gene in a certain comparison (e.g. mutant versus wild type) is plotted against the average expression for this gene for all analyzed genes. Genes shown in red are significantly up- or downregulated in the analyzed comparison.
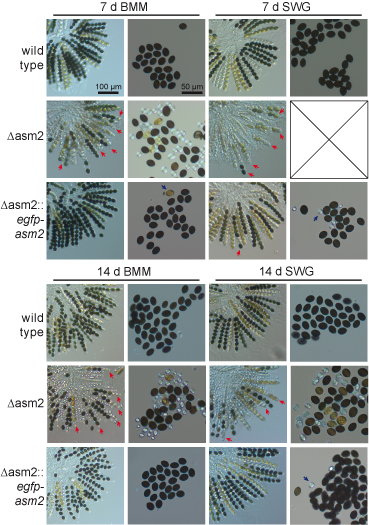
One of the genes that were differentially regulated in mutant pro44 compared to the wild type, is asm2. This gene encodes a putative transcription factor, and its deletion results in defects in ascospore maturation, which can be seen in the figure to the left, where the wild type and the asm2 deletion mutant were grown for one to two weeks on different media (BMM and SWG). A complemented strain (third row for both time points) again shows the wild type phenotype.
2. Comparative functional genomics with Sordaria macrospora, Neurospora crassa, Pyronema confluens, and Ascodesmis nigricans
- The fruiting bodies of filamentous ascomycetes like S. macrospora, N. crassa, and P. confluens are probably homologous structures, i.e. they are derived from a common ancestor. Thus, it is likely that the gene expression patterns that are required for fruiting body formation are also conserved to some degree. To learn more about which genes are expressed during fruiting body differentiation in several fungal species, we started a project to compare gene expression in the filamentous fungi P. confluens and S. macrospora. P. confluens belongs to a basal group of ascomycetes and forms a simple fruiting body called apothecium, whereas S. macrospora is a member of a more derived group and forms the more complex perithecium. A comparison of gene expression between these two species can help to identify genes that have retained their expression patterns throughout fruiting body evolution.
In addition, we have recently sequenced the genome of Ascodesmis nigricans, which belongs to the same basal group of ascomycetes as P. confluens, but makes even simpler fruiting bodies. The genome of
A. nigricans was sequenced in collaboration with the Joint Genome Institute as part of the 1000 Fungal Genomes Project. Future projects include the analysis of fruiting body-specific transcriptomes for this species and comparison with transcriptomes from P. confluens and filamentous
ascomycetes from other phylogenetic groups to sharpen expression profiles of development-related genes.
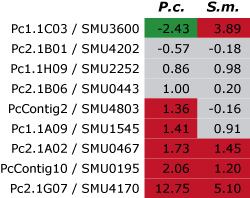
This pictures shows the results of a first
comparison of gene expression for nine genes (here identified by their numbers in each row) from P. confluens (P.c.) and
S. macrospora (S.m.). For each gene, the ratio of gene expression during fruiting body development versus vegetative
growth was determined in both fungi by quantitative real time PCR. The results are given as logarithmic values, i.e. positive
values (red) indicate that a gene is upregulated during development and negative values (green) that it is downregulated.
Values between -1 and +1 (gray) indicate that the gene is not differentially expressed. Among the nine genes, three are
upregulated and another three are not differentially regulated in both species, indicating that there is a large degree of
conservation of gene expression during fruiting body development even in these distantly related fungi.
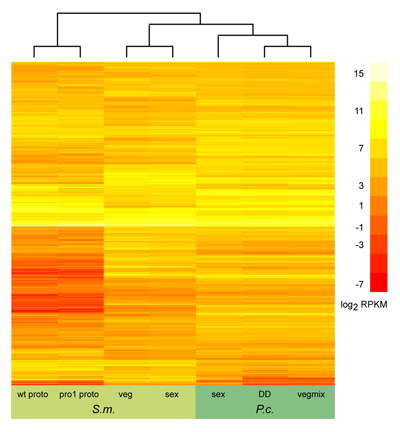
On the left, you can see the results of a similar
comparison, this time including all orthologous genes that were expressed in both organisms (several thousand genes) under
several conditions. Due to the large number of genes, genes are not labelled individually any more. Also, this comparison
does not show gene expression ratios like the picture above, but rather sequence read counts that were the results of
RNA-seq experiments. This comparison was made as part of the Pyronema genome and transcriptome project described above.
More details can be found in the genome publication.
- Next to conservation of gene expression in
different species, another parameter that can indicate functional importance of a gene is its presence within a cluster of
similarly regulated genes, i.e. genes that lie next to each other within the genome. Especially in fungi, such genes are often
members of biosynthesis pathways for so-called secondary metabolites or natural products. Among these are well-known antibiotics
like penicillin, but also highly toxic substances like the mycotosin aflatoxin. Genome sequencing projects have revealed that
fungal genomes contain large numbers of such gene clusters, however, their biological functions are in most cases yet unknown.
One hypothesis is that the products of secondary metabolism might be useful for the producing fungus under certain conditions or
during distinct stages of its life cycle, including fruiting body formation. Therefore, we performed a comparative functional genomics
analysis where we specifically looked for genes that are not only upregulated during sexual development in the two filamentous fungi S. macrospora
and N. crassa, but are also physically clustered within the respective genomes.
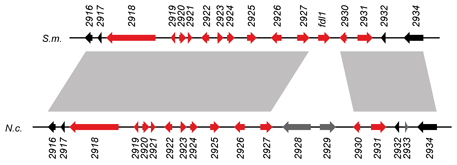
This picture shows one such gene cluster.
The genomic organisation in S. macrospora (S.m.) and N. crassa (N.c.) is indicated, each gene is given as an arrow.
The color indicates whether a gene is upregulated (red) or not upregulated (black or gray) during sexual development. Gene regions
that are connected by gray shading between the two different species are similar, indicating that not only the expression patterns, but also the genomic organisation of
this regions is largely conserved in these two different species. One of the genes (2925) was subsequently shown to be involved
in fruiting body formation, because its deletion leads to slower maturation of fruiting bodies.
- In the previous projects, comparison of gene expression was done at the level of transcription using microarrays or quantitative real time PCR. However, gene expression is regulated at many more levels, and these can be conserved during fungal development, too, as we discovered during the analysis of a fruiting body-specific protein from S. macrospora and N. crassa. The protein was discovered as a highly abundant protein in fruiting bodies of these two ascomycetes and therefore it was called APP (abundant perithecial protein).
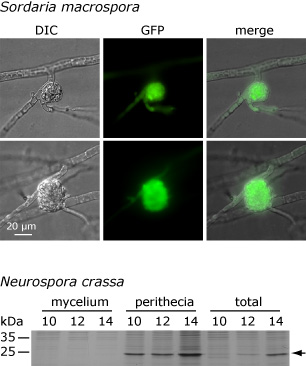
This picture shows that the APP protein accumulates only in fruiting bodies and not in the surrounding mycelium in both S. macrospora and N. crassa. The upper part shows the microscopic analysis of a fusion protein that consists of APP and the green fluorescent protein (GFP). The fusion construct was expressed under control of the app regulatory regions. The picture on the left shows a differential interference contrast (DIC) of a protoperithecium (young fruiting body) with surrounding hyphae, and the green fluorescence derived from GFP can be observed in the protoperithecium but not in the surrounding mycelium. Below, an analysis of the native APP protein from N. crassa is shown. In this case, protein extracts from fruiting bodies plus surrounding mycelium (total), from fruiting bodies alone (perithecia), and from the surrounding mycelium alone (mycelium) were extracted after 10, 12, and 14 days of growth and separated on a denaturing protein gel. The band that represents APP is indicated by an arrow. APP can be found in the total extract and in the fruiting bodies, but not in the surrounding mycelium. These and other analyses indicate that expression of app is conserved in S. macrospora and N. crassa in both time and space. One of our future goals is to elucidate to which degree gene expression is conserved at different levels during fungal development.
3. Analysis of the evolution of sexual development in the Tremellomycetes
- The Tremellomycetes are a group of fungi that belong to the Basidiomycetes, which include, for example, mushroom-forming species. However, the Tremellomycetes are an early-branching group and contain few members that form multicellular structures, rather they often grow as single cells or few-celled mycelia. The Tremellomycetes comprise a number of human pathogens like Cryptococcus neoformans, but also many saprobic fungi. One important aspect of genome evolution in the Tremellomycetes is the evolution of sexual development, for which the Tremellomycetes have become model organisms. Comparative genome analyses among the Tremellales have already indicated a trend towards large mating-type regions, similar to the evolution of sex chromosomes in plants and animals (Heitman et al. 2013, Mycologia 105: 1-27). In basidiomycetes, this manifests as the fusion of of the HD and P/R loci to one mating type locus. However, it is not clear yet how widespread this trend is and if it extends to other branches of Tremellomycetes and therefore might constitute an ancient evolutionary trait. Therefore, in a collaboration with the groups of Robert Kourist (Ruhr-Universität Bochum), Thomas Brück (TU München), Joseph Heitman (Duke University), and the Joint Genome Institute, we have sequenced the genome of the Tremellomycete Trichosporon oleaginosus, which is a member of a little-investigated branch of Tremellomycetes to gain more insights into the evolution of mating type loci in the group. In a subsequent study, we have analyzed additional Tremellomycete genomes to see how prevalent the trend towards the evolution of large mating type regions is. These analyses showed that all analyzed genomes from the order Trichosporonales have fused mating tye loci.
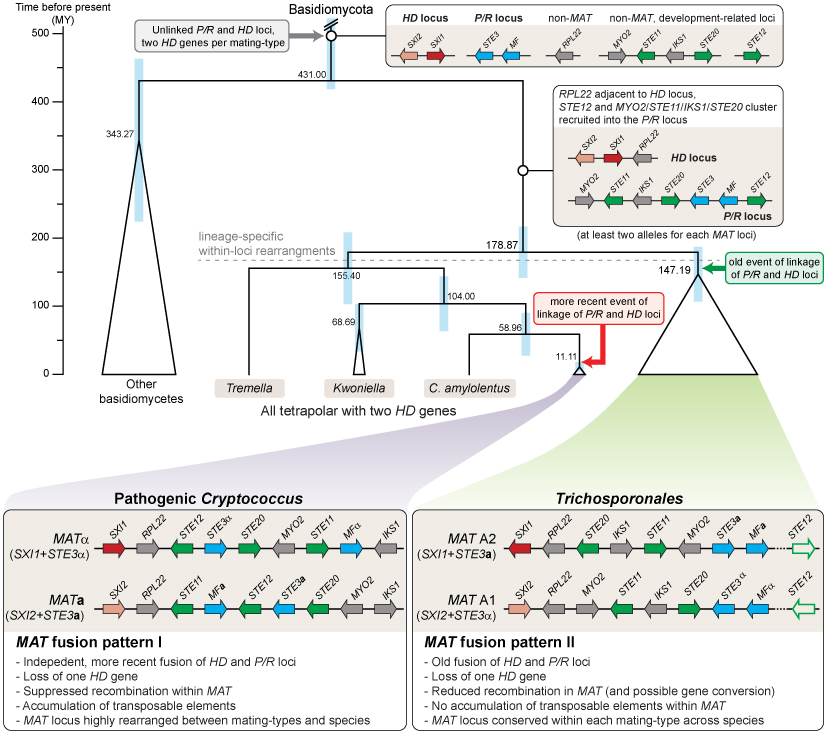
In the figure, you can see a model for the evolution of mating type loci in Tremellomycetes that was developed based on a comparison of the genomes of 24 Trichosporonales species. Genes at the MAT loci containing homeodomain transcription factor genes (HD locus) or pheromone and receptor genes (P/R locus) are shown in red/pink and blue, respectively. Genes involved in sexual development, but not originally part of a MAT locus are shown in green, other genes in grey. Only genes from the C. neoformans MAT locus that are also linked to the core MAT genes (STE3, HD genes) in the Trichosporon lineage are shown (STE11, STE12, STE20, IKS1, MYO2, RPL22), other genes present at the mating type loci are left out for clarity. In pathogenic Cryptococcus species and in the Trichosporonales, there was independent fusion of the mating type loci. Furthermore, there was independent loss of one HD gene per mating type locus. Additional details can be found in the publication in PLoS Genetics (Sun et al. 2019, PLoS Genet 15: e1008365).