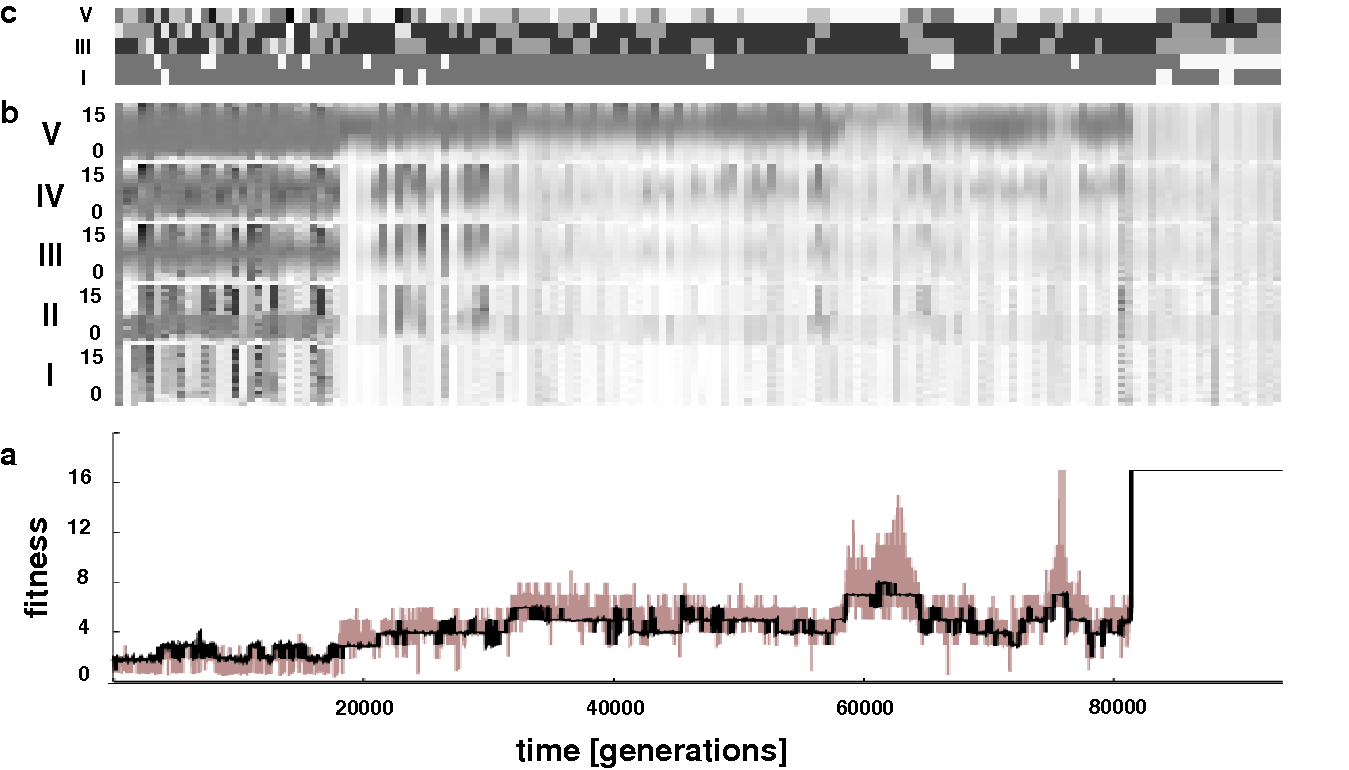
Fig. 4. Typical time course of population evolution for the self-assembling 8-bit multiplier circuit shown in Fig. 1. a) Time course of maximum fitness in the population: in black evaluated using its own test vector, in gray evaluated using random test vectors. The block fitness function leads to stepwise enhancements in fitness. Note the large jump in fitness at generation 82000, corresponding to discovery of a general solution to the problem. b) Population average of success frequencies for individual product bits 0-15, with whiter fields indicating more success, for each of the categories I-V of multiplication tasks (see text). Solutions to these tasks are successively more difficult to evolve. Additionally, the outer bits are logically less convoluted than the inner ones and consequently are correctly multiplied first. c) Relative frequencies of multiplications in the test vector attached to the fittest individual in the population grouped in five categories as in b) with whiter fields indicating higher frequencies. At generation 19000, b) indicates a jump in performance in the class I-IV problems. Consequently, the test vectors concentrate on the final residual category V, as shown in c). When these multiplications have been solved, at about generation 82000, the coevolving test vectors begin to repopulate the other categories again.